I feel like I start these off every year by talking about how fast the year went. I still think back to those days in my early 20s when I lived alone and would actually get bored sometimes on the weekends. I can’t remember the last time I was bored. There’s a never ending list to keep me going.
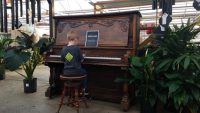
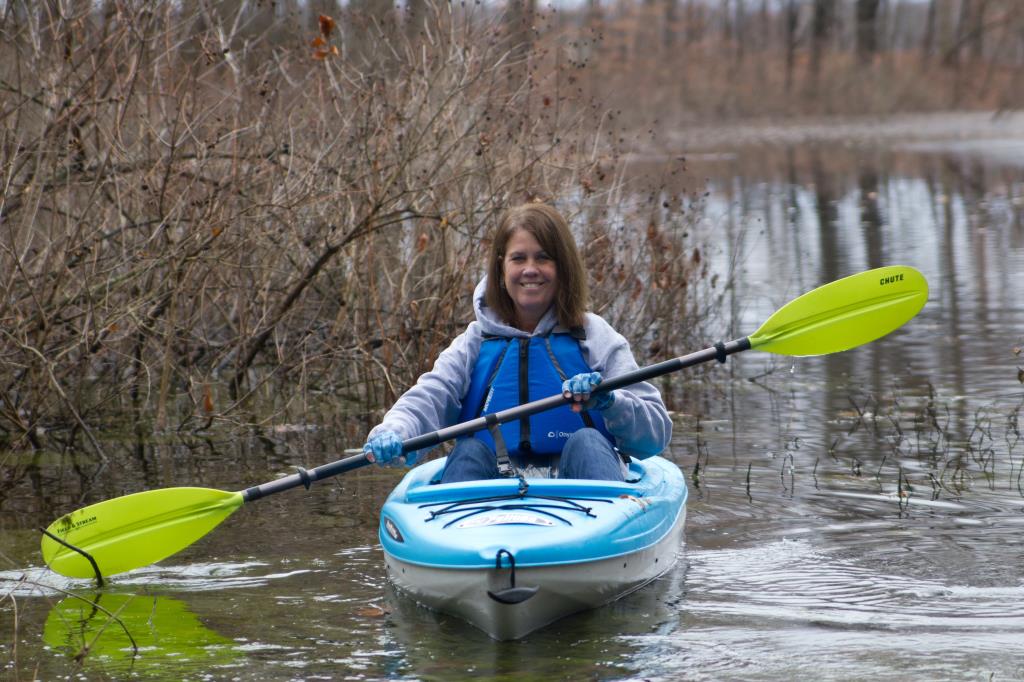
However, since I realize that going full speed all the time isn’t great, I have made a conscious effort to spend more time sitting at the piano every day. Not only is it learning a skill but it’s very relaxing and enjoyable. I’m so thankful that back in 2007, I bought a digital piano (Korg C303) instead of an acoustic one. While it’s not a perfect replacement, there’s no way I could have played so much this year without the ability to plug in headphones. My biggest accomplishment on the piano was learning how to play the first movement of Bach’s Italian Concerto. It was far from concert perfection, but given how far out of my reach it was, I was happy to get it polished to the point that I did.
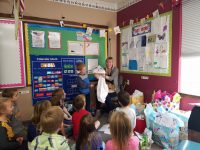
 Elijah started taking lessons too. A piano teacher comes to his school and pull kids out of class for 30 minutes each week for a private lesson. It’s extremely convenient and Elijah is really taking to it well. As with most kids, it’s still difficult to get him to practice every day, but I think he’s having more fun now that he sees the results and can play a few Christmas songs. For his first recital he played Away in the Manger and it went great. I’ll play it with him as a duet in church on Sunday as well.
If you had asked me a year and a half ago where Elijah was going to first grade, I would have said Woodmoor. It’s less than a half mile walk for the two schools that Elijah would use through 7th grade. The proximity to the schools was one of the factors in us buying this house. It’s incredibly convenient and most of our neighbors go there. But… last fall on the marriage retreat, a Pastor suggested that we check out the Missouri synod school up in Lake Stevens. I didn’t even realize there was one and that’s probably because it’s a solid 30-40 minute drive from our house. Elijah repeatedly told us “I want to go to a school where they teach me about Jesus.” After visiting the school and praying a lot about it, we decided to give it a try, and we sure are glad we did! The drive has been even harder than we thought it would be but Tyla is doing a wonderful job with that. She’s also able to volunteer at the school with things like art class, field trips and class parties. So even though we’re probably the family who lives the farthest away, we are feeling like we’re getting connected with their community.
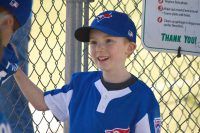
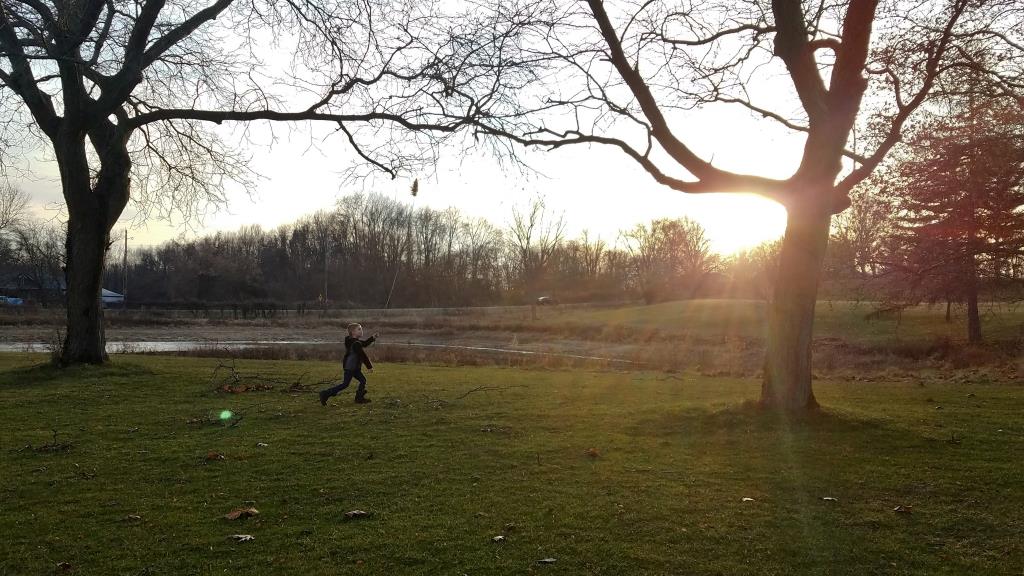
This was the first year that Elijah really started playing organized sports. I thought I’d sign him up for tee ball and was surprised to find out that I had missed that by two years! He went straight into the machine-pitch baseball league. As one of the youngest players on the team, it was a struggle for him to figure out hitting and stay focused, but he loved seeing his teammates regularly and forming a bond with them. He decided he wanted to try it again this year so we’ll see how season #2 goes. This fall he has been in a basketball league too. It’s a fantastic program that is run like a basketball camp that meets once a week in the evenings for 1.5 hours. So the time commitment is much lower than baseball, but he’s constantly learning instead of sitting around during a game wondering if he’ll get the ball or get off the bench. I wish we could find a program like that for every sport that he likes!
Work has been busy for me but also rewarding. There are two patent applications sitting at the patent office right now with my name on them. I met with a lawyer and drew up a patent this spring and then in the fall I was added to the list of names on a patent for a project that I worked on a couple years ago. It will be fun to see if either of those get accepted in a few years.
Tyla and I both lost a grandparent this year. Tyla’s grandma on her mom’s side and my grandma on my dad’s side both passed away. We were thankful that both had a strong faith in Jesus as their Savior so we know we’ll see them in heaven, and we were also thankful that we were able to travel (alone) for the funerals. We were each able to catch up with our respective families.

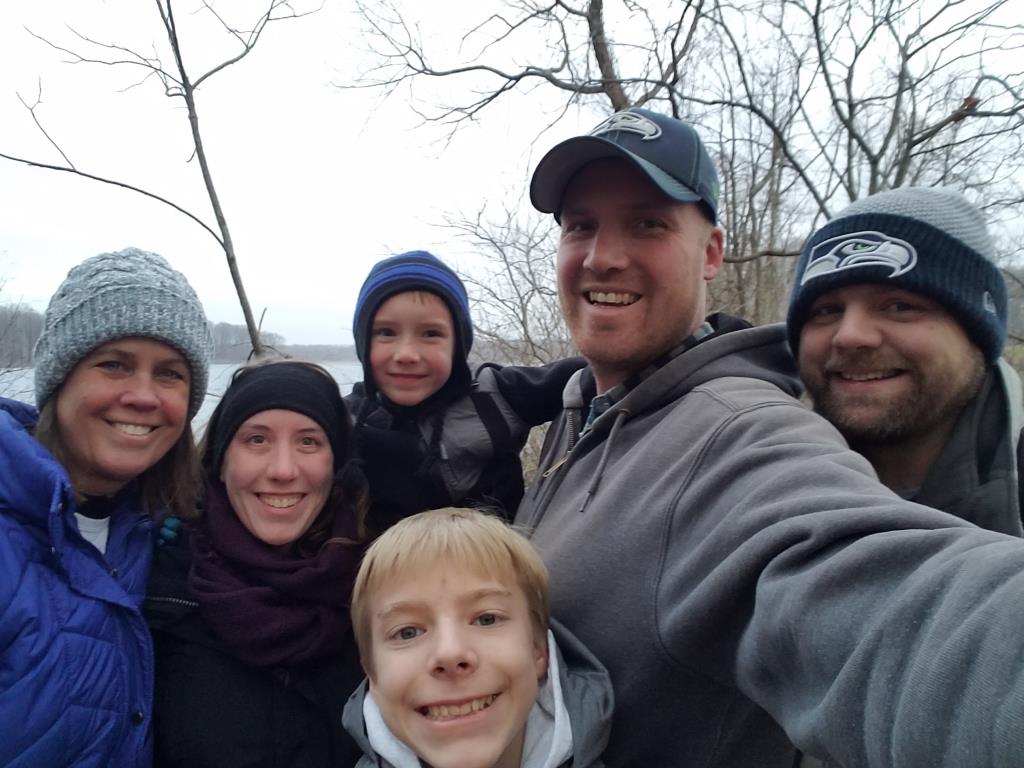
We took a long summer vacation this year that started all the way out in Maine with a return to Camp Ticawa! We are so thankful to the Abendroths for letting us invade their family time and making us feel so welcome. Elijah fit right in with all the kids and we had a wonderful time. After spending about a week there, we flew to Indiana for a week with my family. So we went from spending lots of time in the lake to spending lots of time in the pool! This trip was extra special as we flew Don out to spend a few days with us as a retirement present for him.
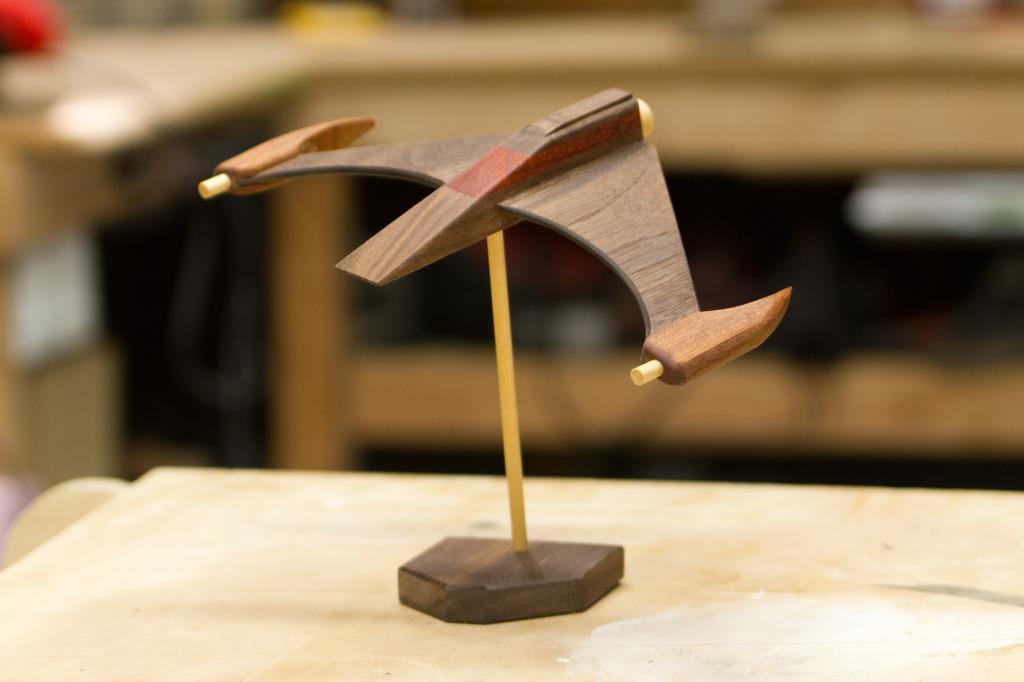
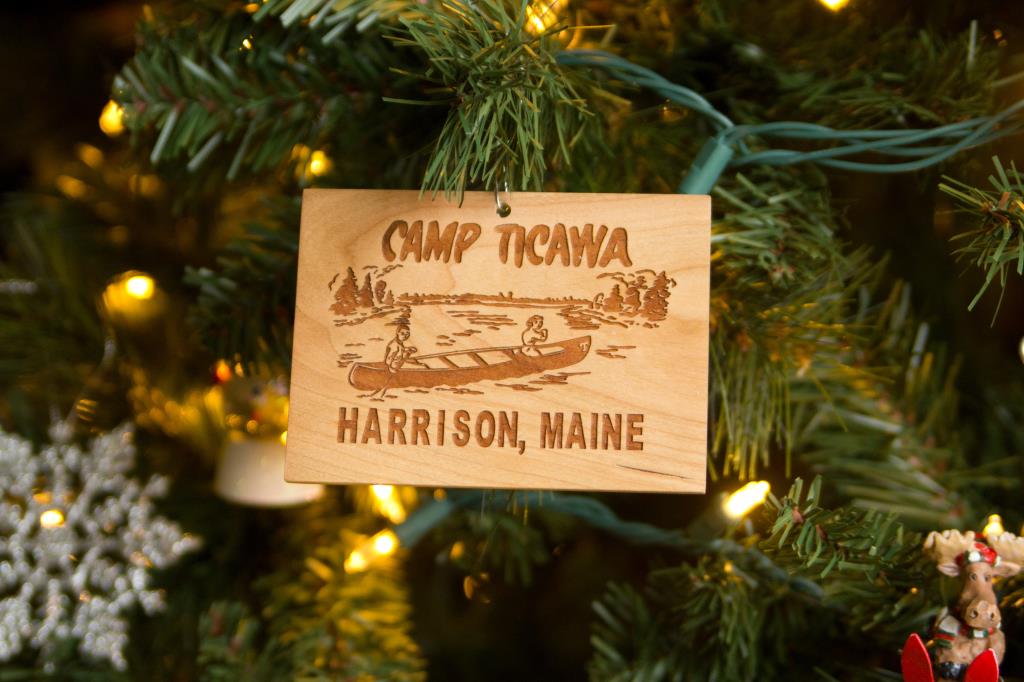
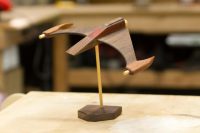 I feel like I haven’t done as many woodworking projects this year, but it’s still a good-sized list: custom thermostat plate, Washington ornaments, mobile strawberry tower, Ticawa sign, loft for Elijah’s bed, Modern Rogue sign, name puzzle, and spaceship. I purchased a CNC machine right around the end of last year and I got a lot more comfortable with it over the year. I have a never-ending list of ideas that i want to try on that machine! Right now I’m working on my hardest project yet which is a dresser out of walnut and cherry. The plans come from Marc Spanguolo in the Wood Whisperer Guild. The plans come with hours of detailed videos showing every step so I’m just plodding along and learning a lot of new woodworking skills. It feels kind of similar to learning that Bach piece on the piano in that this is way over my head but I think if I just keep at it, I’ll be proud of it in the end.
After being the trustee (property maintenance) at church for 7 of the previous 8 years, this year I switched to being an elder. My responsibilities are assisting Pastor with his duties and ensuring that he stays true to the teachings of God’s Word. In addition to the regular monthly council meetings, Pastor has been meeting with the elders twice a month to study through the Grace Abounds book by Daniel Deutschlander. If you already share my faith or if you’re curious to learn more about it, you’d be hard pressed to find a more thorough and pleasant to read explanation than this book.
The final thing I’ll mention from this year is that you may have noticed a decreased presence from me on this site and on social media. I’m getting more and more “itchy” when I think about all the information that our family puts out in the internet. So I made quite a few changes:
- I unfollowed literally everyone on Facebook (unfollowed, not unfriended.) I no longer feel the urge to check Facebook 5 times a day to see if there is anything new there. When I want to see what someone is up to, I type in their name and go look at their page.
- I deleted almost all of my comments, likes, photos and posts from Facebook. It would probably have been easier to delete my account but I still find it useful for messaging and events.
- I’ve been archiving many of my old Instagram posts. That’s a slow process because it’s very manual. The Facebook change was faster because there are some plugins for Chrome that help automate it.
- I flipped my Instagram account to private and dropped the random followers that I don’t know. My woodworking account is still public though.
- I post a lot less to Instagram too. I use the Stories feature for random stuff because it disappears in 24 hours and I try to think of the photos that I post as more of a portfolio of pictures or events that I think are extra special.
- I set almost every pre-2014 post on this site to private. They still exist so if you’re looking for something specific, I can quickly find it and flip it back to public. I’ll probably keep doing that and decreasing the amount of archive that I leave public.
In the past I’ve felt like it was fun to have such a detailed digital record of my life, but now it feels dirty to know how many companies are collecting all that info and using it for their own gain. I’m still a digital packrat at home, but I’m starting to circle the wagons a bit in public.
 So now we’re on the verge of 2020… the year I turn the big four oh. I’m thankful for everything that God has provided in 2019 and look forward to seeing how he blesses and challenges us in 2020!
Previous Year In Review Posts: 2003, 2004, 2005, 2006, 2007, 2008, 2009, 2010, 2011, 2012, 2013, 2014, 2015, 2016, 2017, 2018


Fantasy Football 2019 – Season Wrapup
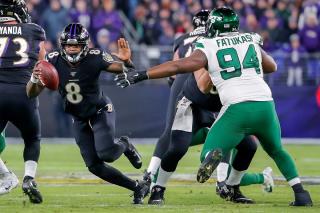
It felt like the Seahawks played a pretty solid game in Philadelphia and they were almost certainly helped out by in-game injuries to key Eagles players. Next week they’ll have an even tougher opponent in Lambeau, but according to the projections, neither of those teams have a great shot at beating the 49ers. Over in the AFC it’s looking like the Ravens will be Super Bowl bound, but it’s the NFL and anything can happen… unless it really is all rigged in which case only the scripted story can happen.
I looked through the stats from this year and found it interesting that Tim dominated the league while only making about a half does changes to his team! I made a lot more transactions (2nd most behind Logan) and got the most points in the league from my signings after the daft:
After dominating the league last year, Mahomes was solid again this year with 339.04 points but Lamar Jackson crushed everyone with 487.68 which is a whopping 74.48 more than second place! However, that second place scorer is Christian McCaffrey and it’s rare that we get anything other than a QB in our top spots. To find the next non-QB, you have to go down to Michael Thomas in 15th with 300.10 points. You can find the full list here.
Here is wall of glory for our league. Congratulations to Tim for not only taking his first victory, but making his first appearance in the top 3 since 2014 when he finished 3rd. And honorable mention goes to Tyler who has been in the championship game both years in the league!
And finally, I pulled the full finishing order for every year and calculated some stats for each manager. It’s a little goofy with some people who joined the league for a year or two and left but I’ll leave them in there.
I hope to see you all back next year! But if you want out, please let me know as soon as you can because I’ll want to find a replacement.