
Welcome to another Tesla Tuesday!
When driving a car powered by a standard internal combustion engine, the speed that gives you the best fuel efficiency is somewhere shortly after the point where you can cruise in the highest gear. That’s generally around 40-45 miles. But electric vehicles don’t have gears, so what speed can I drive if I really want to get the most range?
The short answer is that somewhere around 25-30mph gives optimal range, but the full answer is more complicated.
Other than driving speed, one of the biggest factors is how much air conditioning or heating is being used. Heat in a traditional car is free except for the blower motor, but in an electric vehicle, you pay to generate both hot and cool air. It’s a battery load that varies with temperature, not speed. Other electric loads such as headlights and wipers along with things like tire inflation, elevation, wind, and extra weight can all play a part as well. Most tests are assuming that HVAC is not used and that all the other factors remain constant. Real world values will vary.
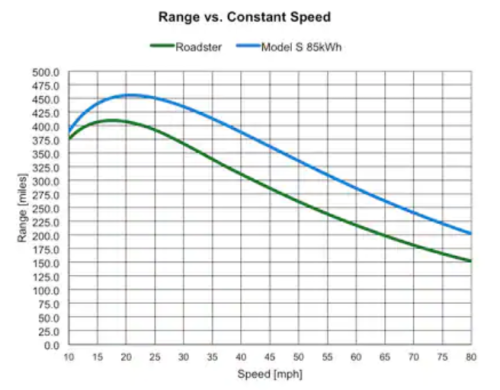
Tesla did a blog post back in 2008 about this topic with the original Roadster. Unfortunately the images don’t load for that post anymore. They have an updated post from 2012 when the Model S was coming out and that does have all the charts available.
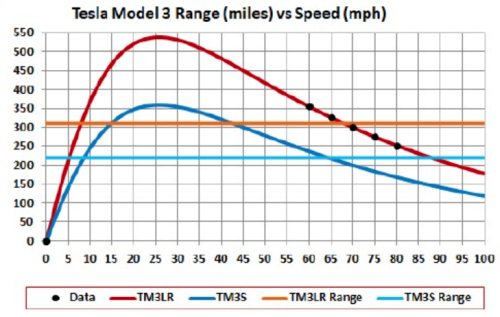
Another chart that I found with an image search shows a similar curve for the newer Model 3.
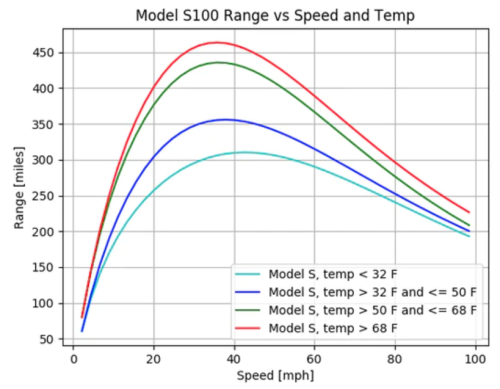
A post on cleantechnica.com does a breakdown of how the Model S range varies with the outdoor temperature. They pulled a lot of real world data donated by owners to generate this chart. It shows how much range can be lost when it’s cold, mostly because of cabin heating. The falloff in cold weather performance is one clear area where EVs lag behind traditional vehicles, but if you go look at Norway (a place we’d all agree is generally “cold”), more than 80% of their new cars sold are EVs. The whole country is transitioning to it. So while this is something to keep in mind, it’s far from a blocker for adoption.
The curves in these charts are generally more interesting than the actual y-axis values because those values will depend on your specific model. And while the shape of these curves is pretty consistent across the Tesla lineup (except maybe the Model X which is huge), they’re no the same across brands. You’ll generally find that there aren’t many cars that sip their battery power more efficiently than Tesla. Their experience really pays off in that category.
A lot of this data is available because Tesla is collecting so much of it and it can be easily shared/collected for these studies. These same laws of physics apply to traditional cars too, but we’re a lot less conscious of it because we can’t see the data as easily. I’ve never heard anyone ask “How much range did you lose when you changed your rims?” or “How much range do you lose because you added running boards to your truck?” But with a Tesla, it’s relatively easy to measure all these impacts.
So now I have a car that’s fun to drive, cheap to operate, and spewing out huge amounts of data! Win win win!