
 Some of the buzz around Windows 8 is that Microsoft should let people go straight into the desktop mode without first landing on the new Windows 8 start screen. I can understand the desire to never ever change anything (while complaining that they’re not “innovating”), but this one is a bit silly. What’s the first thing you did in Windows 95 through Windows 7 when you started your computer? You either clicked one of your shortcut icons to start an app or you pressed the start button to find an app that way. It’s EXACTLY THE SAME with Windows 8. You can either click one of the shortcut icons (tiles) that are on your start screen, or you can find an app by typing and searching for it. If anything, you now have fewer clicks and you also get the added benefit of seeing a screen full of information that you’ve tailored to your interests.
Now there’s also a complaint that Windows 8 doesn’t have a start button. That one I can sympathize with a little more. It bugged me for about a week and then I forgot about it since I always use the keyboard to press the start button anyway. If you want to use the mouse, you just drag down to the lower left of the screen and click like you did before and it brings up the start menu. And here’s a pro tip for you remote desktop users: Alt-Home presses the start button in a remote desktop window.
So yes, there are some changes. People screamed about Program Manager disappearing in Windows 95 but then they fell in love with the Start button. Now things are moving forward again. Like most other things in life, you should try it with an open mind for a couple weeks before you decide if it’s good or bad.
 A lot has changed since the last article about the
  The Hobbit is out and is one of the first movies to offer a higher framerate than standard movies. There was a bunch of other relatively new tech in the theater. Here’s my review of each piece:
 If you use a Surface RT, you may have noticed that Flash only works on some sites. There is a whitelist built in and Flash will only work if the website is on that list. But what about sites like studio711.com? If you want to watch the Flash that is used here, you’ll need to do a little extra work. Of course you’ll be doing something that isn’t recommended by Microsoft so proceed at your own risk. Still willing to try it? Follow the steps at
 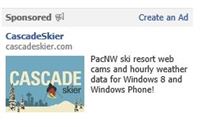 Facebook sent me a $50 advertising credit so I decided to use it to promote my CascadeSkier applications and see behind the scenes of a Facebook ad.
 In addition to regular paper coupons, our grocery store has started a program called “Just For U” where you can clip coupons online. They intend for you to flip through the coupons and add certain ones to your frequent shopper card. Those items show up in the phone app and you are supposed to go buy those specific items. I’ve never been one for clipping coupons, but every once in a while, I go to the site and click Add on every single coupon. We use OneNote to track our shopping lists so their app has no appeal to me. I save a few bucks here and there, but it’s not really worth my time to clip these virtual coupons.
 I’ve spent way too much time working on my most popular Windows Phone app this winter. Version 3.0 hit the marketplace in November and I just released version 3.5. There have been numerous updates for various things but biggest changes were support for multiple live tiles and live tiles that flip over to reveal a one day weather forecast. The updates have been very well received and it’s very rewarding to see the positive reviews fly in. Right now this is the #10 paid app in the sports category. I realize that’s not saying a LOT, but I’m still proud of it.