 Last year, Tyla got me an OBDII data logger (Automatic) for my birthday and, of course, I ended up writing an app to download my trip data so I could analyze it. I still get those analysis reports twice per day and they continue to be interesting. For example, I don’t know why, but the last two weeks have had some of the worst traffic on my way home from work in the last year. Now that I have over a year of data, there’s enough to calculate some semi-interesting stats on my drives in our 2016 F150 3.5L Ecoboost:
-
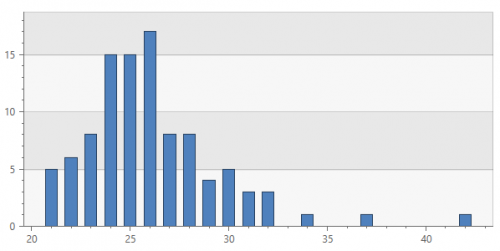
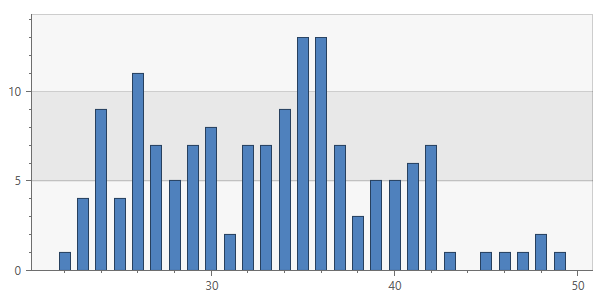
- The average trip to work takes me 26.3 minutes.
- The average trip home takes me 33.9 minutes.

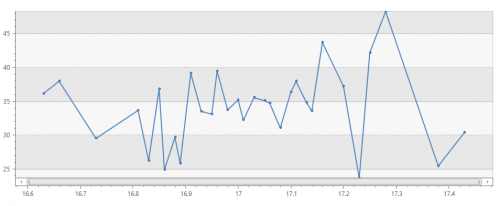
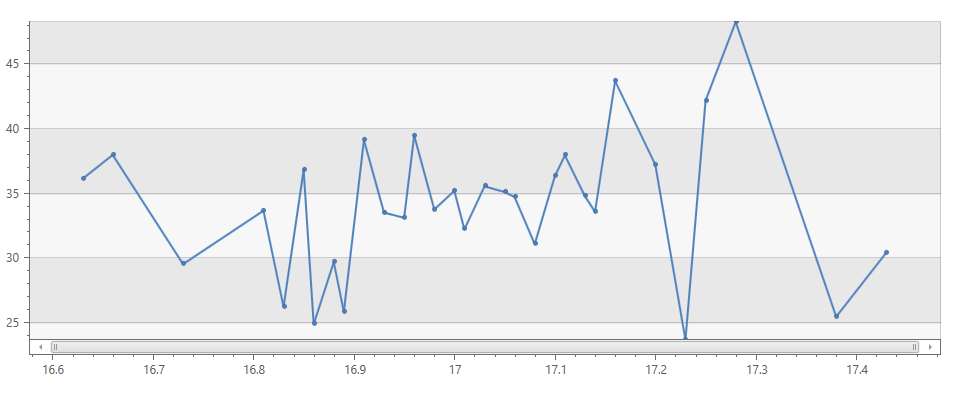
- It feels like if I leave work a couple minutes early, I’ll avoid the worst of the traffic. Here’s my average commute time based on when I leave. (The x-axis is in 24 hour time so 17 is 5pm.) The y-axis is my average commute home in minutes. It does look like if I leave about 10 minutes before 5 my commute is generally 5-10 minutes faster.
- My most fuel efficient trip was a 43.7mpg drive along the 3.5 mile route from my house to Home Depot. Not bad for a 5000 pound truck! (A lot of it is downhill and I like to see how little gas I can use on that route…)
- Best fuel mileage for a trip over 10 miles: Church to Totem Lake AutoZone 28.0mpg
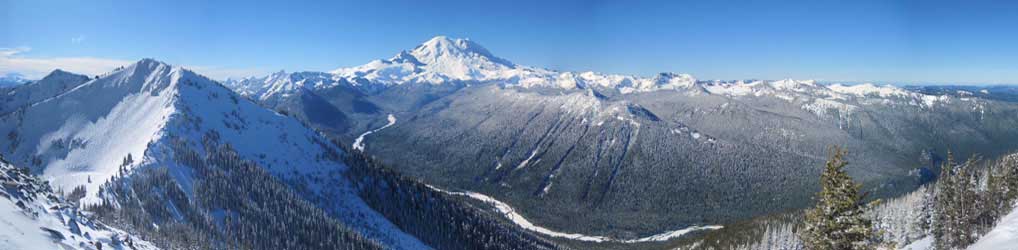
- Best fuel mileage for a trip over 50 miles: Crystal Mountain to our house 24.7mpg
- My worst gas mileage is going from Work to the butcher. It’s a short trip and when it’s really cold, my truck spends the whole time idling at stop lights and trying to warm up. I’ve gotten 3.5mpg on that route a couple times!
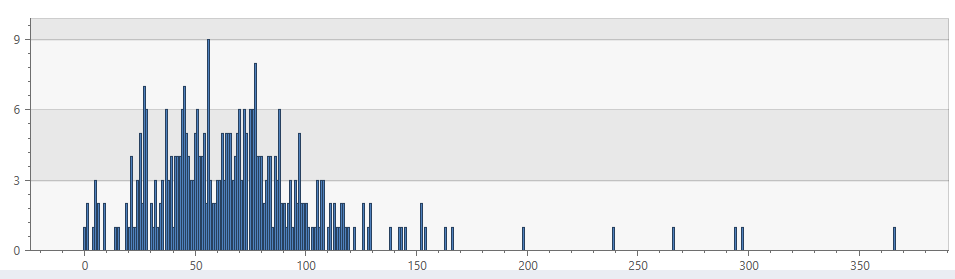
- Of the days that I drive the truck, I spend an average of 69.3 minute driving.

- The most driving in one day was 366 minutes. That was May 25, 2018 when we drove down to Ocean Park for Memorial Day.
- The average trip to work takes me 26.3 minutes.

I love having all this data! I could do this all night but I should probably cut it off here and go to bed. By the way, all of these charts and stats were created with public preview of Azure Data Explorer. We’ve been using that product internally for a couple years and it makes stuff like the stats above ridiculously fast and easy. If you’re at all involved in data engineering or data analysis, you need to get familiar with Azure Data Explorer!
 The site Fiverr.com (pronouned “five-er”) has been around for quite a while, but I just recently used it for the first time. The idea is that you can pay someone $5 (or something very cheap) to do a small digital task for you. You can peruse it yourself to see all the various offerings, but I wanted a pixel art picture of myself.