When power plants churn out electricity, it gets integrated by a “balancing authority”. There are a few dozen groups that handle this in the west.
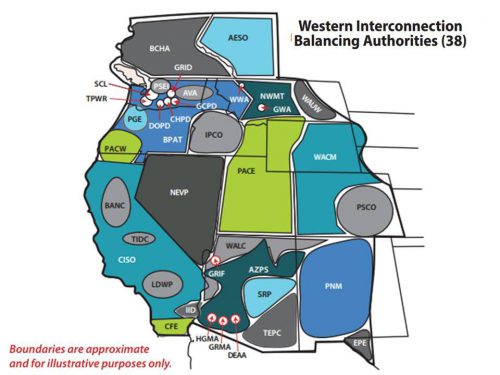
I recently found a site that shows live stats from the Bonneville Power Authority Balancing Authority. On the map, this is represented by the medium blue that covers much of Washington, Oregon, northern Idaho, and western Montana. Every five minutes, the site is updated to show where the power came from those previous five minutes along with the demand level. (Note that VER stands for Variable Energy Resource which means wind, solar, etc. In this case it’s mostly wind.)
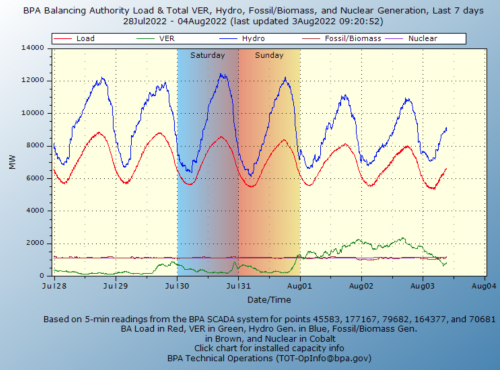
So the last five minutes of power were 75% hydro, 9% fossil fuel, 9% nuclear and 6% wind, but for the last couple days, wind was actually producing more of the power than nuclear.
The power at my house comes through PSE so this isn’t exactly applicable to me, but I still find this fascinating. If anyone knows how to find similar data for PSE I’d love to see it! Thanks to Cliff Mass’s excellent weather blog for setting me off on this side track with his post about why energy production declines during heat waves.