
 I use Internet Explorer for most of my work and play but sometimes I also fire up Chrome. I love Chrome’s extension model for expanding the capabilities of the browser. I was very excited to hear that Edge (the new Windows 10 browser) is going to be supporting Chrome extensions! I haven’t flipped over to Edge yet because it doesn’t have any extensibility so I can’t run AdBlock or LastPass, but once they enable these extensions, I’ll be able to upgrade to Edge. It’s a great (and ambitious) idea. I hope they can pull it off cleanly.
Windows 10 Thoughts
 Windows 10 is a big deal, and I have lots of thoughts about it. Instead of splitting them up into a bunch of posts, I’ll try to list them all here and you can pick and choose what might be interesting to you.
Should you upgrade?
If you’re an early adopter, you’ve probably already upgraded to Windows 10. Good! I’ve done it on most of my machines, but if you’re not in a hurry then it’s fine to wait. I’m waiting for a month or two to upgrade Tyla’s computers and I won’t upgrade the computers at church until January or February. However, you should definitely upgrade before about June next year. Microsoft is giving free upgrades for one year. Don’t miss out!
If you do upgrade now, the one change that I recommend is to not use the new Microsoft Edge browser as your default. At least that’s what I’m doing on my machine. I really like the new browser and it is super fast, but it also doesn’t support any plugins yet and that’s a deal breaker for me. I like to run AdBlock and LastPass and I can’t do that in Edge yet. Support for plugins is coming later this fall and it’s going to be awesome because Edge will support Chrome plugins! To change your default browser, open the start menu and search for “default web browser”.
What does it mean that “Windows 10 will be the last version of Windows”?
You hear this a lot in the media and even from Microsoft. What it probably means is that there won’t be a Windows 11. We’ll just see incremental changes to Windows 10. This is similar to how Apple has been handling updates to their operating system for the last few years. You’ll get feature updates on a more regular basis, but I’m sure there will still be plenty of marketing and fanfare around some of the releases.
Will I like it better than Windows 7 or Windows 8.1?
I’m the wrong one to ask about this. In fact, the question makes me a bit cranky because people love to talk about how much Windows 8 stinks. I find that most people dislike it because of a couple tiny UI things like the start screen and the charms bar. If that’s enough for you to hate it, fine. Everyone gets their opinion. Personally I almost never see those UI things and it doesn’t bother me at all. I love the additional OS features that are available in Windows 8 like Storage Spaces, Hyper-V, and more.
In general, I think people will be more receptive to Windows 10 than Windows 8 for the simple reason that it has a start menu. So many people get stuck on that one tiny fragment of the operating system, and there, now you have it. You also have ~5 years of awesome new features that have been developed while you were still on Windows 7. Welcome to the future!
Why is Microsoft offering it for free?
There are lots of articles about how Microsoft is dramatically changing their business model by offering Windows 10 for free. This statement oversimplifies the situation. First of all, they are only offering free upgrades to home users who already have a legal license for Windows 7 or Windows 8.1. The vast majority of Windows income comes from enterprise sales and sales of new PCs. Neither of these money makers is included in this free offer. Sure, it’s a big deal and I’m happy about this offer, but it’s not like half of the company’s money is disappearing.
People who state this also fail to comprehend where Microsoft makes their money. Lots of media people only think about the consumer facing stuff: Windows, Office, Xbox, Phone. They forget that there is a third pillar that as big as Windows and Office (and is growing much faster): Cloud and Enterprise. This team has a whole bunch of new billion dollar business and the growth rate of some of these products is incredible. For example, Azure had triple digit year over year growth in both revenue!
How did they make the picture for the Windows 10 logon page?
Nobody has asked me this question, but it has a cool answer. Check out this video to see behind the scenes: https://www.youtube.com/watch?v=hL8BBOwupcI It’s an actual photo, not something designed on the computer.
If You’re Excited About The Start Menu In Windows 10, You’re Doing It Wrong
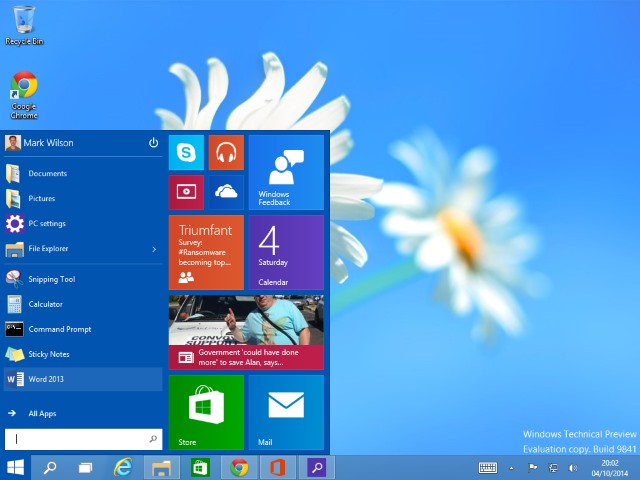 How’s that for a click-bait post title? A little long maybe… anyway, I say it with tongue in cheek. Obviously you can use your computer however you want. But my point is that people who are excited about the start menu are usually using their computer a little bit inefficiently. Ever since Vista, there has been an awesome keyboard shortcut that obviates the need to use the mouse in the start menu. To start ANY program on your computer, press the Windows key on your keyboard and then start typing. Whether you’re on Windows Vista, 7, 8.1 or 10, the Windows key will bring up a search box and then as you type it will start filtering through the programs you have installed. Once it finds the one you want, just press enter. I do it so quickly that you can’t even really see what’s going on as the screen flashes around. And that’s the point. It’s FAST.
Here’s an example: press the Windows key and then type notepad and press Enter. Don’t worry about what is happening on the screen. When you’re done, Notepad will be open. Do the same thing for Word, Chrome, Excel, Spotify, Solitaire, etc. It’s so much faster than using the mouse to fumble around and navigate to find the program you want to use.
I think this is one main reason why Windows 8 never bothered me. I don’t really care about the start screen because I never click around it and it only flashes on my screen for fractions of a second throughout the day.
Miles Per Gallon
 Seven years ago, I purchased a Scan Guage and I still recommend that you pick one up for yourself if this stuff interests you. It taps into your car’s computer and gives you access to lots of the sensor data. I use it most for tracking exactly how much gas I’m using and what mileage I’m getting.
For most of that time, I had the display showing me lots of information about how many miles per gallon I was getting, but recently I realized that’s a little messed up. Miles per gallon is a good measurement if your route is unchangeable, but it misses the mark if you can choose a route. For example, I have two main routes to work. One is 12 miles and uses the interstate and the other takes backroads and is only 9 miles. The interstate route generally gets me better mileage (though it’s generally clogged with traffic so it’s not a huge win.)
I changed the ScanGuage to start showing me how many hundredths of a gallon of gas that I was using on each trip and I discovered realized that the shorter route almost always uses less gas even though I get fewer miles per gallon. So if my goal is to use as little gas as possible, I should actually choose the route with lower MPG. It’s sort of counterintuitive and obvious at the same time.
New Horizons
 On January 19, 2006, the New Horizons probe left earth on it’s long journey to Pluto. In less than two weeks, it will make it’s closest pass to Pluto. Let’s take a minute to ponder some of the incredible math/physics associated with this journey:
- It took just over one year to reach Jupiter for a slingshot boost to Pluto, but even with the increased speed, it has taken another 8 years to get to Pluto.
- It’s the fastest spacecraft ever launched: 36,373 mph.
- Pluto is 10.5 times farther from the sun than Earth is
- From 2007-2014, the probe woke up only once per week to send a message saying that everything was ok and then it also woke up 50 days per year to do some science and course monitoring.
- When it passes by Pluto, it will have traveled 2.96 billion miles.
- After traveling all those years and all those miles, it has to hit an area of space that is only 186 miles in diameter to achieve it’s objective.
- There were three scheduled course corrections although the second was canceled because the first one was so accurate. There was another course correction after passing by Jupiter and one more at about the halfway point in 2010. In total, the spacecraft only burned about 20-30 minutes of fuel to make course corrections!
- After passing by Pluto, the probe will continue on to examine objects in the Kuiper Belt. The mission could last another 10 years.
Church Website Updates
When I stepped out of the property manager role at church at the end of last year, I stepped into the IT role. After a network and PC update, it has been going pretty smooth so I decided to look for something else to break fix.
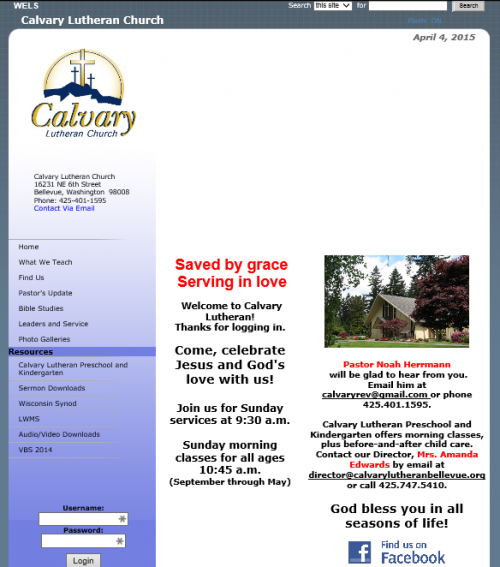
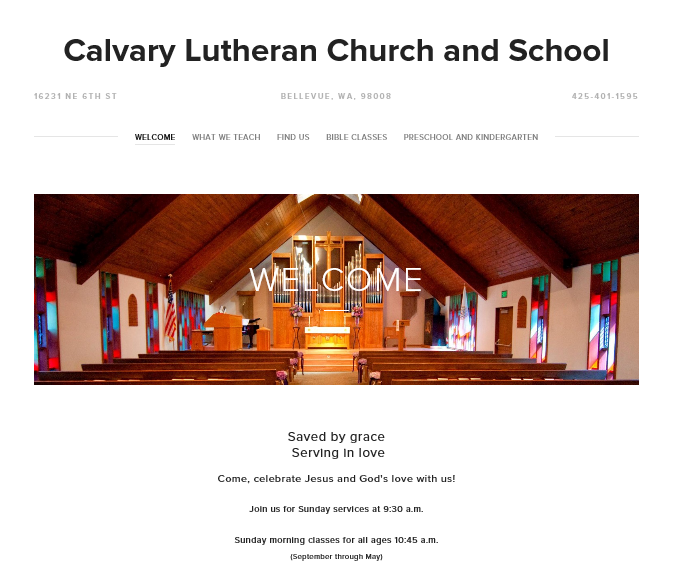
We had been using a service for our web and email hosting that catered to churches. It’s a great way for non-technical people to get a church website going. Unfortunately it’s pretty limited. I got control of our domain name from them, switched to a new email provider and then moved our web hosting to SquareSpace. I literally spent 15 minutes copying and pasting the old content into a new design template and it already looks so much better. BethH is going to take it from here and actually spend some time with the design, layout and content to make it even nicer.
You can see it at http://www.calvarylutheranbellevue.org/ or check out the before and after below. I don’t love the long domain name but we’re kind of stuck with it now. I might purchase a shorter one and forward everything to the longer one but we’ll see.
It’s really nice to have control of all the various pieces and to be using a top-notch web host like SquareSpace. If you need to create a website, you need to check them out. While they will hold your hand for a very simple setup, you can also get really geeky and dive deep into lots of different options.
Before:
After:
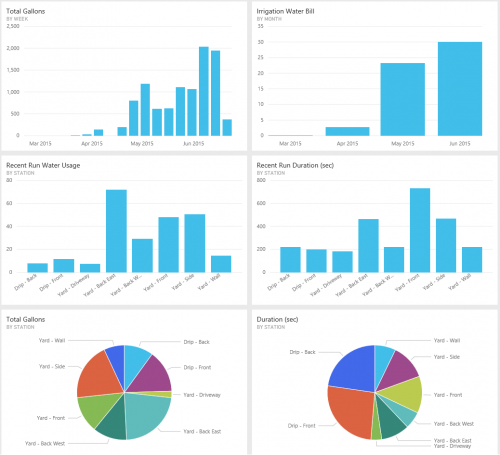
OpenSprinkler With Power BI
I’ve been happily using OpenSprinkler to control my irrigation system this year. One of its many features is logging how long each zone is on, but I haven’t done much with those logs yet. Last weekend, I decided to dig in to the data.
The first thing I did was write a little app that runs every morning, checks the latest logs, and uploads the new data to a SQL database in Azure.
Then I stood out by the water meter and figured out how much water each zone used. That included the startup usage (since water drains out of some heads when the zone is off) and the usage per minute. That let me calculate how much water I’ve been using over the past few months.
I fired up Power Query for Excel and brought in all the data so I could get some nice Power View charts and graphs going. (Note that I could also have used the new Power BI Designer instead of Excel, Power Query and Power View.) I saved that workbook to OneDrive and imported it into PowerBI.com. I set up PowerBI.com to automatically refresh the workbook every morning and show me the charts on a dashboard.
It might sound complicated but it only took me about an hour of work and that included standing out by my water meter for 15 minutes. Now I can fire up the PowerBI.com website every day and analyze my water usage. Since this isn’t based on an actual water flow meter, it won’t help me find leaks, but it does help me get an idea of how much money I’m spending to keep my yard green. I’m also working on some new features that will keep track of the high and low temperatures each day along with the precipitation.
You can get a long way in Power BI before you need to pay for anything so go give it a shot if this sparks some ideas in your head.
R.I.P. Windows Media Center
 Microsoft has announced that Windows Media Center will not be present in Windows 10. Some of you know that’s how I run all the TV in my house and were asking what I’m going to do. The answer? Nothing. It’s not a big deal.
Even though Windows Media Center was shipped with Windows 8, the code is exactly the same as it was in Windows 7. If you’re running a Media Center PC, there’s no reason to upgrade it past Windows 7. Mine sits in a closet with a heavily restricted firewall and I turn off automatic updates. It’s an appliance, not a general use computer. Every few months, I carefully back everything up in case of an emergency and then apply all the patches and driver updates that have accumulated.
So while I’m bummed that a great product is officially dying, I knew it was dead years ago. However, my Windows 7 Media Center box will continue to live and work just fine. I’m guessing that this setup will outlast my desire for cable TV. I’m getting closer and closer to cutting that subscription entirely.
Like Riding A Bike
I’ve written about the Smarter Every Day YouTube channel previously, but it continues to be excellent. I can’t wait until Elijah is old enough to start watching and understanding these with me.
One of the latest videos is an excellent example of the series. What would happen if your bicycle handlebars worked opposite of a normal bike? When you turn left, the bike turns right and vice versa. Easy right? With a little practice you could figure that out. Or could you?
Drought
 Even though the Pacific Northwest had a terrible ski season, we’re not doing too badly on our water supply to get us through the summer because there was just more rain than snow. But whenever drought rears it’s ugly head (like it has been in California for the past few years), you hear lots of talk about taking shorter showers, not filling your swimming pool, not watering your lawn, etc. But does that really make a difference?
This blog post has a lot of interesting charts and data showing how water is used in each of the fifty states. (Also, the charts are really fun to play with, but make sure you use Chrome because they don’t render well in IE.) There’s a ton of great information in there. For example, did you know that Idaho and Utah use way more water per person than any other state? But less than 2% of that water is used for domestic purposes. If you look at total water used, California uses WAY more than any state but most of it goes to irrigating arid land so it can be farmed.
So yes, taking a 3 minute shower will help, but it’s not even a drop in the proverbial bucket.