I was talking to Luke recently and was surprised to find out that in his over 500 beers, he has never rated one 5 stars. That got me thinking about how we all use the rating scale. Here are some stats…
| Row Labels | Average | Standard Deviation | Max | Min |
| Ben | 2.91 | 1.03 | 5 | 0 |
| Dad | 3.54 | 0.70 | 5 | 0 |
| Logan | 3.22 | 0.80 | 5 | 1 |
| Luke | 3.18 | 0.78 | 4.5 | 0 |
| Grand Total | 3.24 | 0.87 | 5 | 0 |
The standard deviation column gives a bit of a feel for how much each user uses the full spread of ratings available to them, but it’s still a bit hard to visualize. So I took all of the ratings and rounded them down so that there were only 6 buckets (0-5). Then I calculated what percentage of each user’s ratings were in each bucket. So effectively, the histogram below is normalized across all users so we can compare apples to apples (e.g. I rate 39% of my beers a 3 and Luke rates 61% of his beers a 3.)
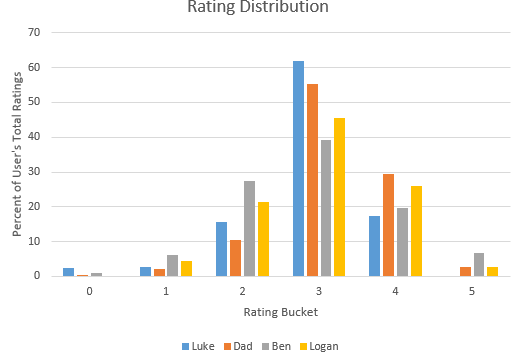
Obviously everybody has their own system for how they use the available ratings, but it does look like they are all close to a normal distribution centered around 3 which makes sense. I think I’ve written this before, but here’s how I personally use the ratings:
- 0 – Yuck. I’d pour it out if you handed it to me. (e.g. Bud Light Lime)
- 1 – I’d politely decline or hand it back if you offered me this.
- 2 – Sure, I’ll drink this but I wouldn’t pay for it.
- 3 – An average beer. I don’t have a problem paying for this but I don’t seek it out.
- 4 – This is a really good beer. If I see it in the grocery store, I’ll probably buy it.
- 5 – Epic beer. Buy it whenever you see it!
And since that’s how I do it, it’s obviously the right way to do it.