Welcome to another Tesla Tuesday!
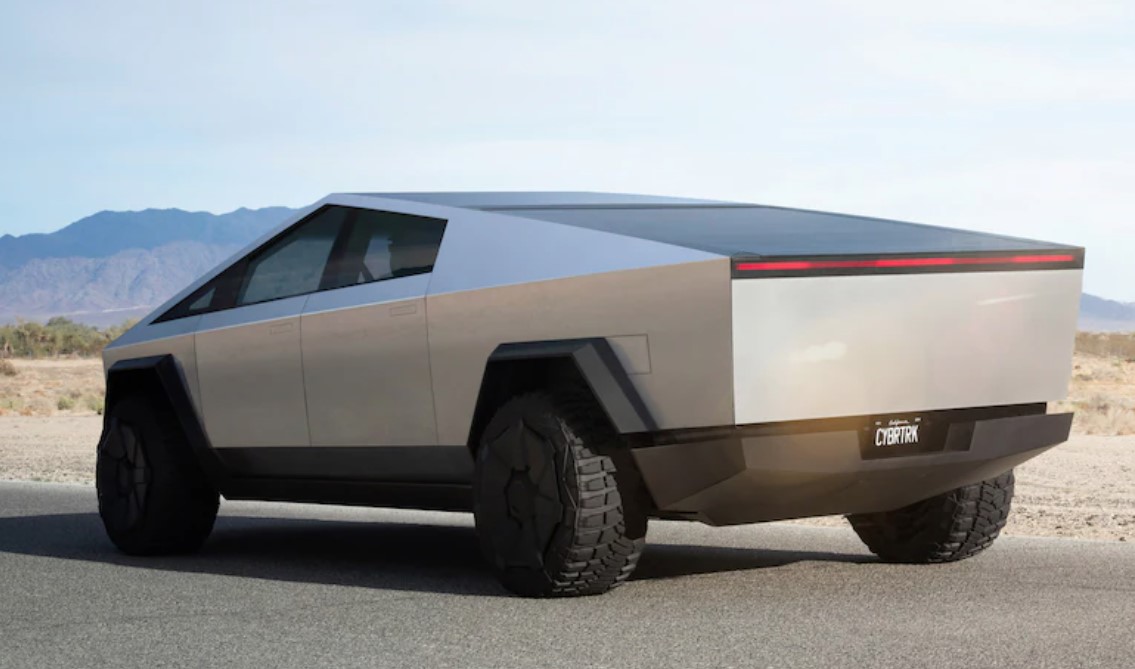
The Tesla Cybertruck was released last week. It was announced all the way back in 2019 and now customers are finally taking deliveries. Let’s start with the positives…
The truck is an incredible feat of engineering. The AWD version does 0-60mph in 4.1 seconds and the “Cyberbeast” model does it in just 2.6 seconds. It does all that while having almost as much payload and towing capacity as my maxed-out internal combustion F150. As a visual to help explain how wild it is to cover both ends of the speed/towing spectrum, Tesla released this video of a Porsche losing a drag race to a Cybertruck… while the Cybertruck is also towing the same Porsche model.
There’s a video showing it in winning handily in a pulling competition against other EV trucks and a diesel F350. There’s also a video of the truck being “bulletproof” or at least bullet resistant. During development it was claimed that the truck would also be able to cross open water though I haven’t seen that independently tested yet.
So yes, it’s a technological marvel, but (and this is a big but)… yuck. It looks like a Pontiac Aztec had a baby with a kindergartener’s drawing of a truck. Teslas have extremely low coeffecients of drag and I’m sure that factored into the design, but still, I know that design is subjective, but I have zero interest in driving this eyesore.
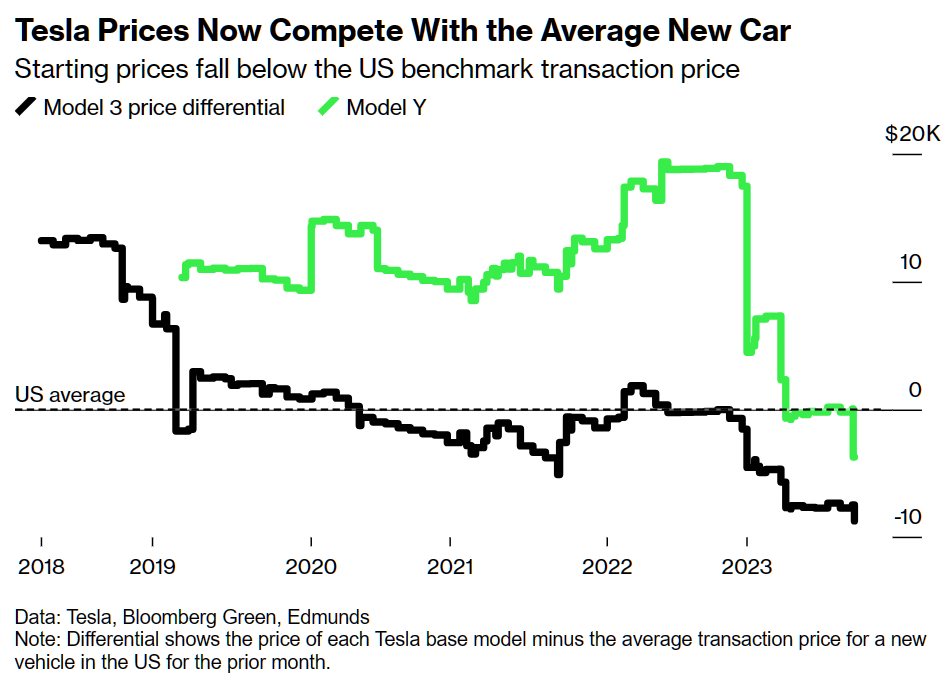
When it was announced four years ago, I disliked it so much that I worried it would sink the whole company. Now we’re in a world where Tesla is probably going to claim the title of best selling vehicle on the planet of 2024. They will probably be ok even if the Cybertruck is a flop.
But will it be a flop? I doubt it. It might level out to be the lowest selling of their models after the initial hype, but I think they’ll sell enough of them to cover their development costs. Tesla incite a fan reaction only seen in companies like Apple. They can make anything they want and people will line up to buy it and rave about how great it is.
If I was replacing my internal combustion F150 today, I’d probably end up buying another gas truck. Rivian is good but their trucks are small for what I want. The electric F150 is intersting but I don’t trust the traditional manufacturers to make a good EV or back it up with a good ownership experience. We’ll get to a point where big trucks make sense as EVs, but I think today the best we can do is smaller trucks like the Rivian R1T.